


Count Bobulescu
-
Posts
252 -
Joined
-
Last visited
-
Days Won
1
Content Type
Profiles
Forums
Events
Articles
Dining Guide
Posts posted by Count Bobulescu
-
-
Tuesday evening the UK government asked for 250,000 volunteers to assist the NHS, hoping to achieve target in a few days.24 hours later they had 405,000.
-
 1
1
-
-
From Twitter
Prince Charles is isolating at Balmoral with Covid-19
Prince Andrew is isolating at Windsor with Jennifer-1715 minute finger prick home test kits to be widely available in the UK this week. First to those with symptoms, later to the broader public.-
 2
2
-
-
NY state with 25K cases, although not as densely populated as Italy, is now at comparable per capita infection rates of 105/100K, and considered 12 days behind, so more likely to end up worse than Italy..
-
Sure, but no-one is suggesting that reducing greenhouse gas is a cure-all for all that ails food production. It's one component. Other components (e.g.heavy water consumption for red meat) need different solutions.That's one reason the synthetic beef companies are attracting investors. The more successful those companies become, the more likely you are to see taxes on traditionally produced red meat, to compensate for "excessive" water use.With need for fewer cattle, both water consumption and GG production decline.
-
More evidence in support.....Food production accounts for 25% of Greenhouse Gas. 25% of production is discarded, = 6% of GG.
-
On 3/22/2020 at 11:47 AM, deangold said:
From the WHO situation reports:
I check the WHO situation reports daily. There are great weaknesses in their data and it is usually a day or more behind Worldometer or Johns Hopkins data. But it is easy to track changes because they make all past reports available.
China had 116 new cases in their situation report 61. {this number disagrees with Worldometer}
In report 60 it was 126
In report 59 it was 58
In report 58 it was 39
From South Korea
61: 147 {this number disagrees with Worldometer}
60: 239
59: 93
58: 84
These have to be disturbing trends that need exploration. Again, they do not match Worldometer's numbers.
Paging Dean.............
COVID-19 deaths and cases: how do sources compare?
There are thre big global datasets on COVID19: the World Health Organization, Johns Hopkins University, and the European CDC
We brought the data from all 3 together to allow you to compare the data – globally and for every country in the world.
We also explain why we stopped using WHO data. -
Axios......LAST YEAR, on the next-to-last Sunday in March, United flew 419,000 passengers at a load factor of 91%. YESTERDAY, United flew 64,000 domestic passengers at 24%. Last Sunday -- March 15 -- United flew 233,000. They lost 169,000 passengers from last week to this week.
-
No fault absentee voting is available in Md. You can request an absentee ballot at the link. You still have to mail it back......
https://voterservices.elections.maryland.gov/OnlineVoterRegistration/VoterType
-
1 hour ago, Pat said:
The cases in the District seem to be skewing pretty young to me, with quite a few cases of people in their 20s and 30s and not so many in the 60+ range.
Photos from the Cherry Blossoms over the weekend suggest a significant number of people not practicing social distancing.If we get to lock down status, pet owners can take heart. In Spain they've been pimping out their dogs for multiple walks a day at $30 a go.-
2
-
-
-
Here's a free FT piece on the Imperial College Study referenced above.
---
First a bad news, then a good news story from OZ.I noted up thread that the current OZ PM is not generally a fan of science or any restrictions etc.Sydney Morning HeraldThirty-five people linked to a wedding south of Sydney have tested positive for coronavirus, as wedding industry vendors become increasingly anxious about being exposed the the virus.
Good news....Scroll down to the story on Melbourne
---
In addition to the sites Dean mentioned above, here are two more.
These people use data primarily provided by the European CDC
A seventeen year old in Seattle Avi Schiffman (sp ?) is getting a lot of attention for this. Simple & easy.
-
The election to replace Elijah Cummings in Baltimore, will be mail only.......it's a start.
-
Sometimes bad stuff just happens, and can't be avoided, and sometimes it can be easily avoided.....
SoftBank Owned Patent Troll, Using Monkey Selfie Law Firm, Sues To Block Covid-19 Testing, Using Theranos Patents
-
The number of cases outside China has just surpassed the number within. 80K v.81KOut of 82K cases that have been closed globally, (recovered plus fatalities) there have been 6,000 fatalities 7%, plus another 6K cases 7%, of the remaining 80K, currently considered critical.Currently there are big differences in cases per capita by country. Italy is worst with 350 per 1M of population. S. Korea, Iran, and Spain at 165, Germany, France, at 65, UK, 20, and US at 9. At a similar rate to current Italian, US could expect 115,000 cases, and 8,000 fatalities. Hopefully.........
-
Here's the chart I posted at 9pm Tuesday.............
Country,
OtherTotal
CasesNew
CasesTotal
DeathsNew
DeathsTotal
RecoveredActive
CasesSerious,
CriticalTot Cases/
1M popChina 80,777 +23 3,158 +22 61,481 16,138 4,794 56.1 Italy 10,149 +977 631 +168 1,004 8,514 877 167.9 Iran 8,042 +881 291 +54 2,731 5,020 95.7 S. Korea 7,513 +35 58 +5 247 7,208 54 146.5 France 1,784 +372 33 +3 12 1,739 86 27.3 Spain 1,695 +464 36 +6 135 1,524 101 36.3 Germany 1,565 +341 2 18 1,545 9 18.7 USA 975 +271 30 +4 15 930 8 2.9 Diamond Princess 696 7 245 444 32 Here's the current chart. Switzerland thru Japan all had fewer cases than Diamond Princess on Tuesday.
Country,
OtherTotal
CasesNew
CasesTotal
DeathsNew
DeathsTotal
RecoveredActive
CasesSerious,
CriticalTot Cases/
1M popChina 80,824 +11 3,189 +13 65,573 12,062 3,610 56.2 Italy 17,660 1,266 1,439 14,955 1,328 292.1 Iran 12,729 +1,365 611 +97 4,339 7,779 151.5 S. Korea 8,086 +107 72 +5 714 7,300 59 157.7 Spain 6,043 +811 191 +58 517 5,335 293 129.2 Germany 4,181 +506 8 46 4,127 9 49.9 France 3,661 79 12 3,570 154 56.1 USA 2,499 +252 51 +2 49 2,399 10 7.5 Switzerland 1,375 +236 13 +2 4 1,358 158.9 UK 1,140 +342 21 +10 18 1,101 20 16.8 Norway 1,052 +56 2 +1 1 1,049 27 194.1 Netherlands 959 +155 12 +2 2 945 45 56.0 Sweden 953 +139 2 +1 1 950 2 94.4 Denmark 827 +23 1 +1 1 825 2 142.8 Japan 804 +70 22 +1 122 660 35 6.4 Diamond Princess -
Gonna be interesting to watch the different approach being taken in the UK. While others are suggesting that country X is Y days <12 behind Italy, the Brits think they are four weeks behind Italy, and are tailoring their response accordingly. They are trying to match their period of peak public response, to the period of greatest danger.Scroll to 32 minutes of this vid where BoJo turns it over to the boffins. Segment runs 15 minutes. One says two week school closures right now are a fool's errand, and that 13-16 weeks are needed for significant effect.
-
China to send aid to Italy......... Corriere Della Sera
-
Broadway shutting down, Ohio closing all schools for three weeks.
-
The idea that Tom Hanks and wife are two of the just 156 people in OZ who have the virus, strikes me as implausible. Suspect the real OZ numbers are much higher. The current OZ PM is cut from similar cloth as he who shall not be named.Getting harder to make sense of the reported numbers.Currently for the US on March 11, WHO is reporting 696 total cases, CDC 938, and Worldometer 1,364. Plan for worst, hope for best.Apparently, CDC is reporting that on March 11, eight tests for Coronavirus were conducted in the US. That also seems had to believe.
-
In Italy, all stores except food and pharmacy to remain closed until March 26.
-
5 hours ago, ktmoomau said:
I assume the death counts have a lot to do with the average population age, as well as, care available?
Not so much average population age, more that the elderly are much more vulnerable. 90%+ of Italian fatalities have been elderly, 75+. More effort is being put into saving the young. Care available, less clear. Healthcare in Northern Italy is fairly robust, but there are warnings that the system is on the verge of collapse. 12% of infected are medical staff.White House considering travel restrictions/warnings for all of Europe.Merkel says up to 60% of Germans at risk of infection.Congressional physician tells Chiefs of Staff that 70-150M Americans at risk of infection.Fatality rate still unclear, but many multiples of flu.......10 to 30 times. -
The table is from Worldometer......
Notice, that in the last 24 hours Italy has reported more new cases than the US has in total.......
Will we be Italy or India with 62 cases and zero deaths?
Confirmed Cases and Deaths by Country, Territory, or Conveyance
The coronavirus COVID-19 is affecting 119 countries and territories around the world and 1 international conveyance (the Diamond Princess cruise ship harbored in Yokohama, Japan). The day is reset after midnight GMT+0.
Search:Country,
OtherTotal
CasesNew
CasesTotal
DeathsNew
DeathsTotal
RecoveredActive
CasesSerious,
CriticalTot Cases/
1M popChina 80,777 +23 3,158 +22 61,481 16,138 4,794 56.1 Italy 10,149 +977 631 +168 1,004 8,514 877 167.9 Iran 8,042 +881 291 +54 2,731 5,020 95.7 S. Korea 7,513 +35 58 +5 247 7,208 54 146.5 France 1,784 +372 33 +3 12 1,739 86 27.3 Spain 1,695 +464 36 +6 135 1,524 101 36.3 Germany 1,565 +341 2 18 1,545 9 18.7 USA 975 +271 30 +4 15 930 8 2.9 Diamond Princess 696 7 245 444 32 -
I came across the first table below, on a Euro forum, and was prompted to seek out the comparable US number, 2nd table. As one who grew up under an EU healthcare system, I'm often bemused when I hear Americans call for EU style systems, particularly the UK. Kinda like, the truth, but not the whole truth.While much is "free" a lot is also rationed, see bed numbers below.Saw a claim that 10% of doctors in Lombardy (Milan) are infected. Why so bad in Italy compared to Germany? Explanation I heard by WHO doc on NPR now makes more sense. Comparisons with flu only go so far. Spread follows a different path.
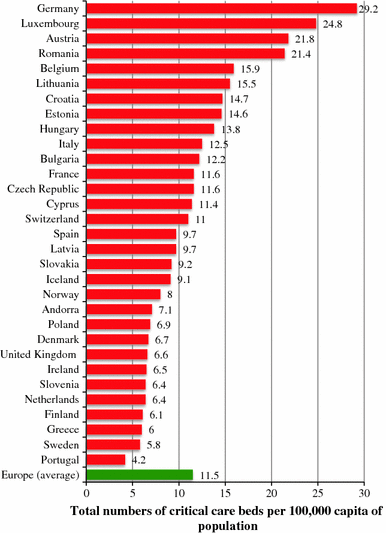
Numbers of critical care beds corrected for size of population (per 100,000 inhabitants) for European countries
Table 1.
U.S. Hospitals, Hospital Beds, ICU Beds, and Population between 2000 and 2009
2000 2001 2002 2003 2004 2005 2006 2007 2008 2009 Hospitals 3,468 3,424 3,363 3,323 3,334 3,280 3,247 3,222 3,199 3,155 Hospital beds 621,578 616,679 616,454 615,468 619,395 618,743 619,894 623,775 627,378 627,112 ICU beds 67,579 67,710 68,920 70,258 71,468 72,678 74,533 75,863 76,803 77,809 ICU bed proportion 0.109 0.110 0.112 0.114 0.115 0.117 0.120 0.122 0.122 0.124 Population 20+ 200.9M 203.8M 206.9M 209.5M 212.2M 214.9M 217.6M 219.9M 222.3M 224.3M Population 65+ 35.0M 35.3M 35.9M 36.4M 36.9M 37.5M 38.3M 39.1M 40.2M 41.1M Hospital beds per 100K Population 20+ 309.4 302.6 298.0 293.8 291.9 287.9 284.9 283.7 282.2 279.6 Population 65+ 1,776.6 1,745.9 1,718.0 1,692.7 1,678.4 1,649.9 1,620.3 1,594.1 1,561.8 1,526.5 ICU beds per 100K Population 20+ 33.6 33.2 33.3 33.5 33.7 33.8 34.3 34.5 34.5 34.7 Population 65+ 193.2 191.7 192.1 193.2 193.7 193.8 194.8 193.9 191.2 189.4 Definition of abbreviations: ICU = intensive care unit; K = thousand; M = million.
Region level ICU beds and ICU beds per 100,000 capita varied widely in all study years (157.5- to 419.7-fold for ICU beds; 6.6- to 32.0-fold range for ICU beds per 100,000 adults; and 6.5- to 18.4-fold range for ICU beds per 100,000 elderly adults) (Figures 1A–1C).
-
Choose your delivery app wisely.............
QuoteThe real price of eating in Food delivered via an app can cost as much as 91% more than ordering the same dish in the restaurant, the N.Y. Times' Brian X. Chen found:
- Why it matters: "When you order through a delivery app, you pay multiple parties, including the driver and the companies that offer the apps, like Uber Eats and Postmates. In some cases, you pay the restaurants extra fees as well."
Chen used Grubhub, Uber Eats, DoorDash and Postmates to fetch turkey sandwiches from Subway, and a "family value meal" from Panda Express.
- His findings: "The markups can be downright egregious."
Keep reading (subscription).


Voting for Elections on the Internet
in Current Events
Posted
I believe so. I opted for both. My understanding is that they will mail/email both ballots about 3 weeks in advance.